The platform comes with a number of use cases implemented to demo how to deploy various network functions/services.
The typical flow of steps for a service orchestrated by the GIN orchestrator are listed below:
Step1 : An external actor initiates an api call to the model registry microservice to register the dem model.
Step2: The model registry component compiles the TOSCA model.
Step3: The model registry component saves the TOSCA model in the Dgraph database.
Step4: The model registry component delegates to the Reposure component for saving the model archive (.CSAR) file in a repository.
Step5: The Reposure microservice saves the model archive in a repository in the cloud to make it readily available to other components of the orchestrator. Once a model is fully registered in the system, it is available for service instance creation.
Step6: An external actor initiates an api call to the TOSCA based service orchestrator to create a service instance from a model that has been previously registered in steps 1– 5.
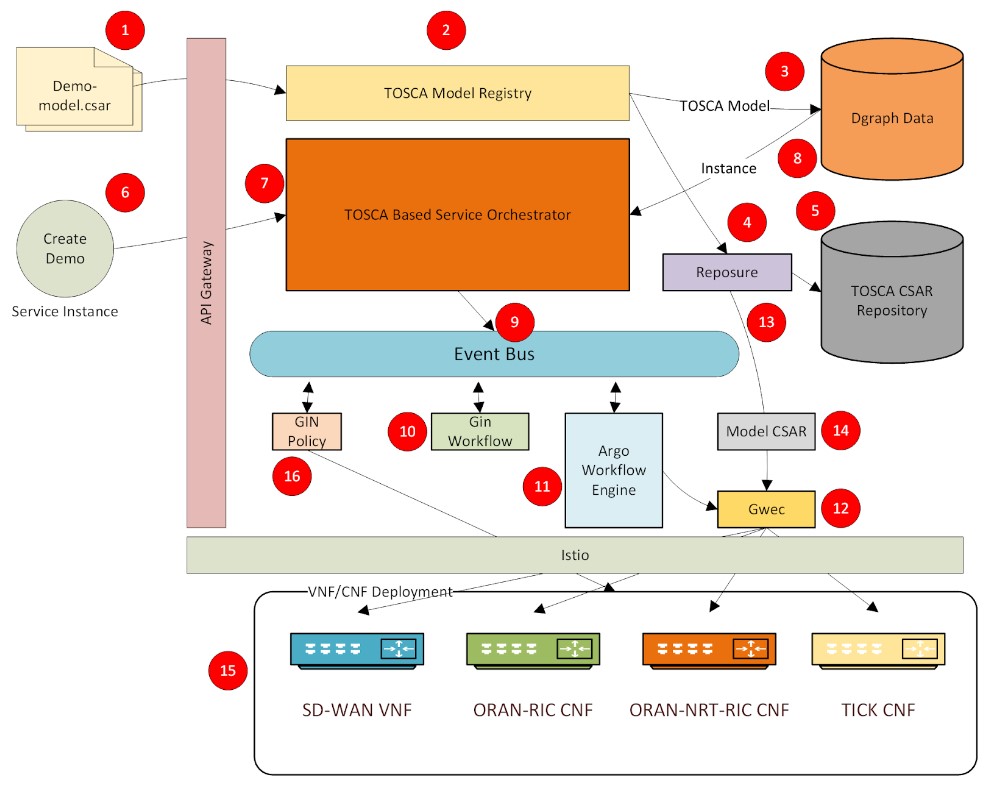
Step7: The service orchestrator reads the model from the Dgraph database and compiles it into a service instance resolving all the relationships and references defined in the model.
Step8: The service orchestrator saves the service instance in the Dgraph database.
Step9: The service orchestrator publishes an event to the bus indicating the service instance is ready for creation.
Step10: The GAWP microservice that is subscribing to the instance creation event generates the Argo workflow template from the relationships defined in the model and in turn publishes an event indicating that the workflow has been generated.
Step 11: The Argo workflow service subscribes to the workflow generation event, begins to process the workflow.
Step 12: The Argo workflow executes each step of the workflow in a GWEC microservice.
Step 13: The Reposure service fetches the requested model artifacts from the repository and delivers it to the GWEC component that is executing the workflow step.
Step 14: The GWEC component extracts the artifacts from the model returned by the Reposure service, and executes the next workflow step as dictated by the Argo workflow engine.
Step 15: The orchestrated service is deployed
Step 16: If there are any policies defined in the model, the orchestrator applies them to the deployed service. Any closed loop policies are set up at this stage of the orchestration.
A. ORAN Service Model – demonstrates TOSCA based O-RAN deployments, focusing on the following:
- Cloud infrastructure deployments, including at the Edge
- Deployment of all O-RAN components, including SMO & RICs. CU, DU, and RU have not been implemented due to incomplete open source solutions at the present. The model will be enhanced as O-RAN-SC introduces support for those components.
- Deployments for traffic steering consisting of QP (QoE Predicter), QP-driver (helper function between TS and QP), and TS (Traffic Steering) xApps
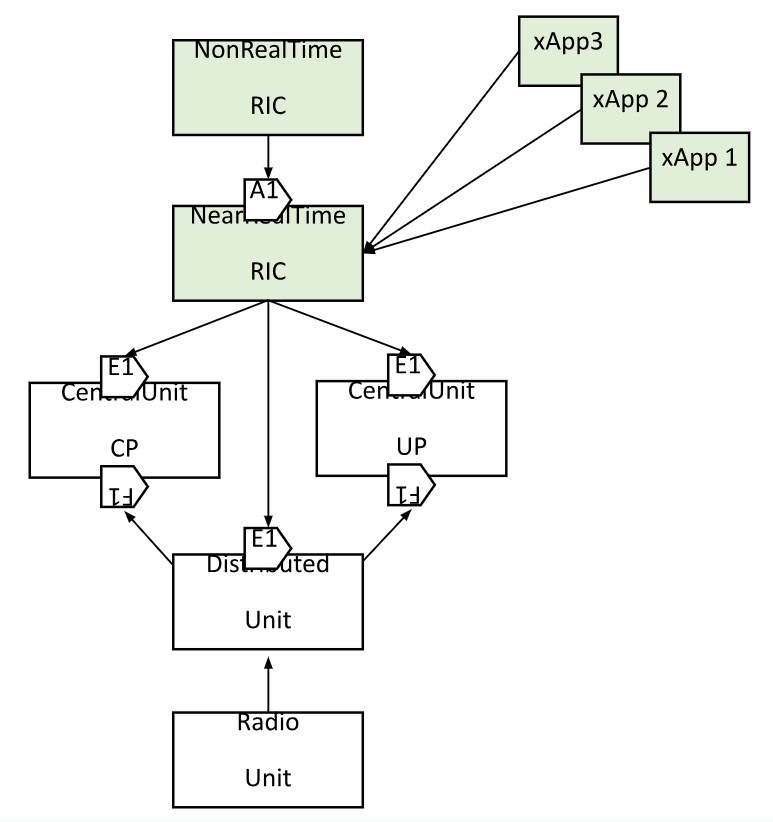
The use case consists of 5 TOSCA models one each for non-real time RIC, near-real time RIC, and each of the xApps. The non-realtime and near-real time RIC components are deployed as Kubernetes pods using Helm charts packaged as artifacts in their respective TOSCA model archives (.CSAR files). The xApp TOSCA models have support for xApp onboarding and deployment.
B. SD-WAN Service Model – software-defined wide-area network (SD-WAN or SDWAN) is a specific application of software-defined networking (SDN) technology applied to WAN connections such as broadband internet, 4G, LTE, or MPLS. It connects enterprise networks — including branch offices and data centers — over large geographic distances.
GIN has an SD-WAN use case modelled in TOSCA to demonstrate one of the key aspects of SDWAN which is secured tunneling of data between two sites. This is achieved using open source SDWAN software from flexiWAN. The actual orchestration of the SDWAN components is done by the GIN Orchestrator.
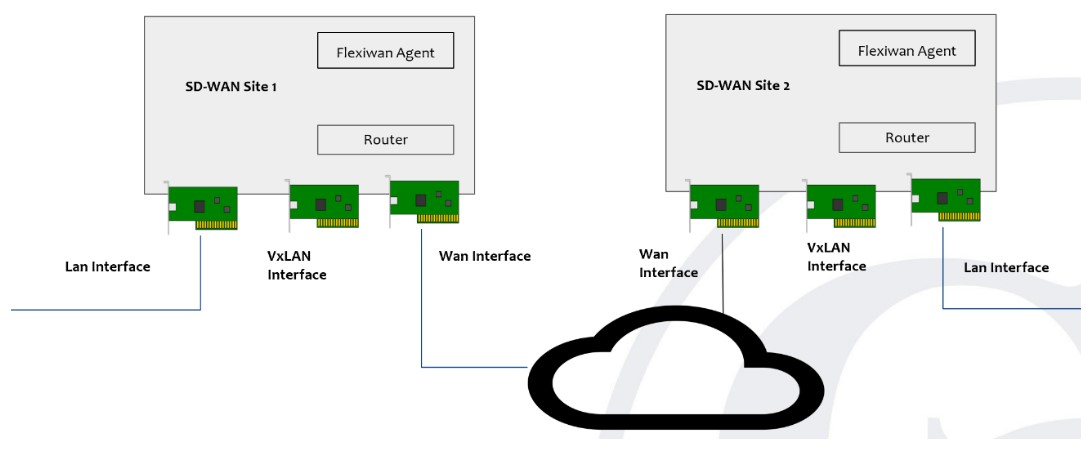
The objective of the use case is to demonstrate how GIN can perform lifecycle management of SD-WAN service without using the SD-WAN controller. Following steps were undertaken for the proof-of-concept solution:
- Deploy 2 SD-WAN devices in form of Linux virtual machines running on separate networks
- Install Flexiwan software on each device
- Start SD-WAN router service on each device
- Create secure tunnel endpoints
- Test branch connectivity between the end-points.
Steps#3 – #5 are done without engaging the Flexiwan controller. Instead, they are achieved through artifacts that are packaged with the TOSCA model.
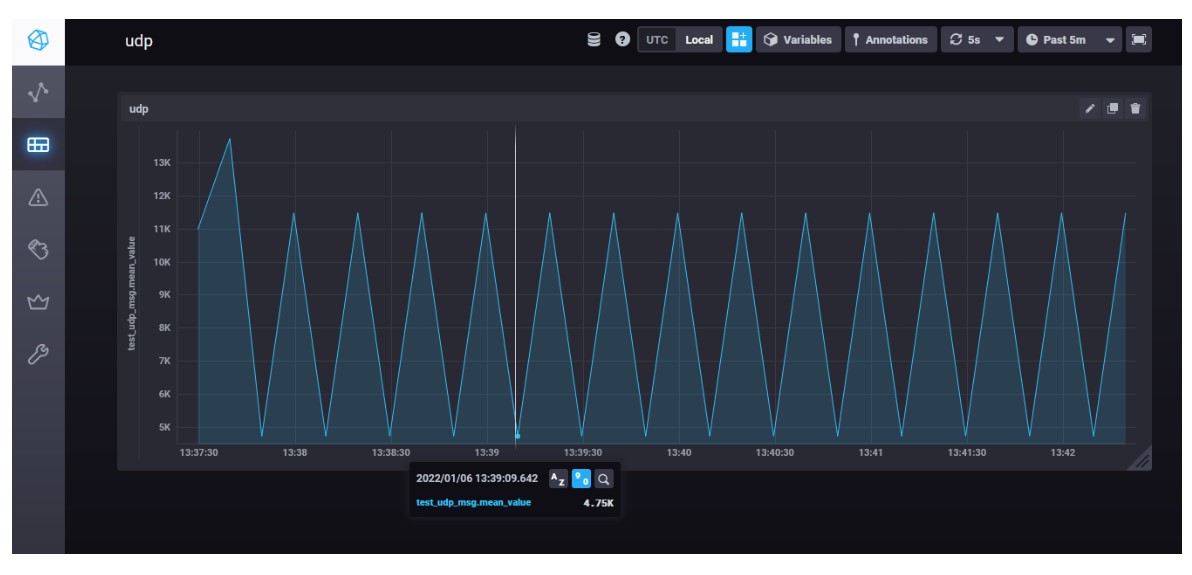
C. TICK Based Service Model – demonstrates a service having a closed loop policy with a data collection and processing stack from Influx called TICK. It is composed of four services: metrics generator, VES Telegraf data collector, Influx time series database, Chronograf data visualizer, and Kapacitor data processor. These are all microservices deployed in a Kubernetes cluster. The metrics generator reports volume of traffic passing though to the VES Telegraf data collector which uses the DMAAP messaging bus. The metrics generator includes a REST API that allows the volume of traffic it generates to be changed. The VES Telegraf collector stores the metrics in Influx time series database. The Kapacitor data processor reads the data from the time series database, and generates events based on alarms setup to trigger when certain thresholds for the traffic volume are breached. These alarms are configured to send notification events to the DMAAP event bus where the GIN Policy engine is listening for such events to update the traffic volume on the metrics generator. The closed-loop policy has been configured to re-adjust the traffic volume when high-water or low-water marks are crossed.
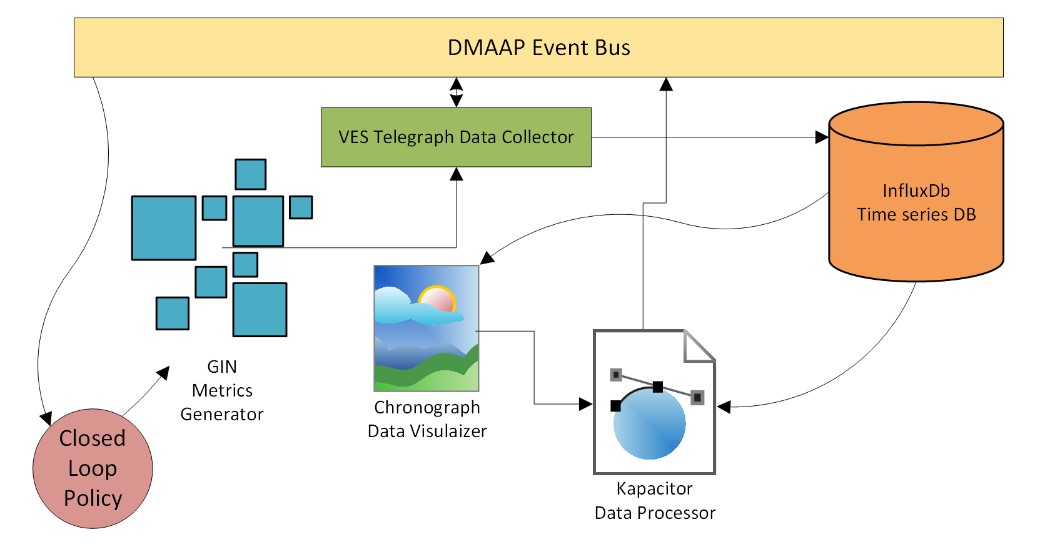
The Chronograf visualizer is used to display the metrics and show how the closed loop policy is working to keep the trafific volume flowing within a range between the low and high thresholds.
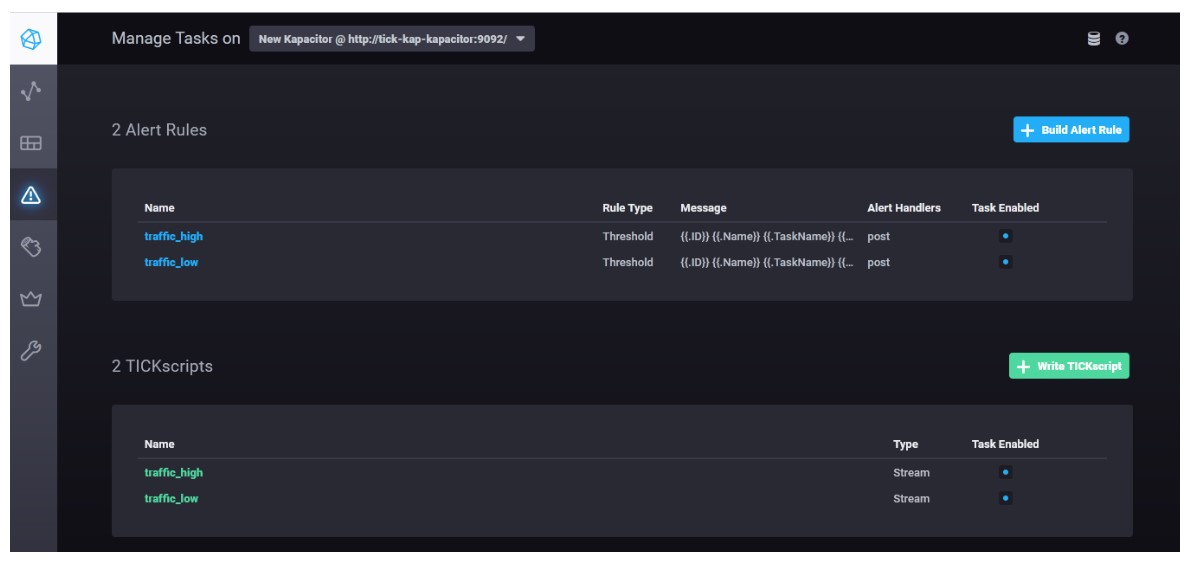
The low and high traffic alerts are setup as shown below in the Komparator to post events to the messaging bus.
The graph below shows the workflow steps executed to deploy/orchestrate this use case.
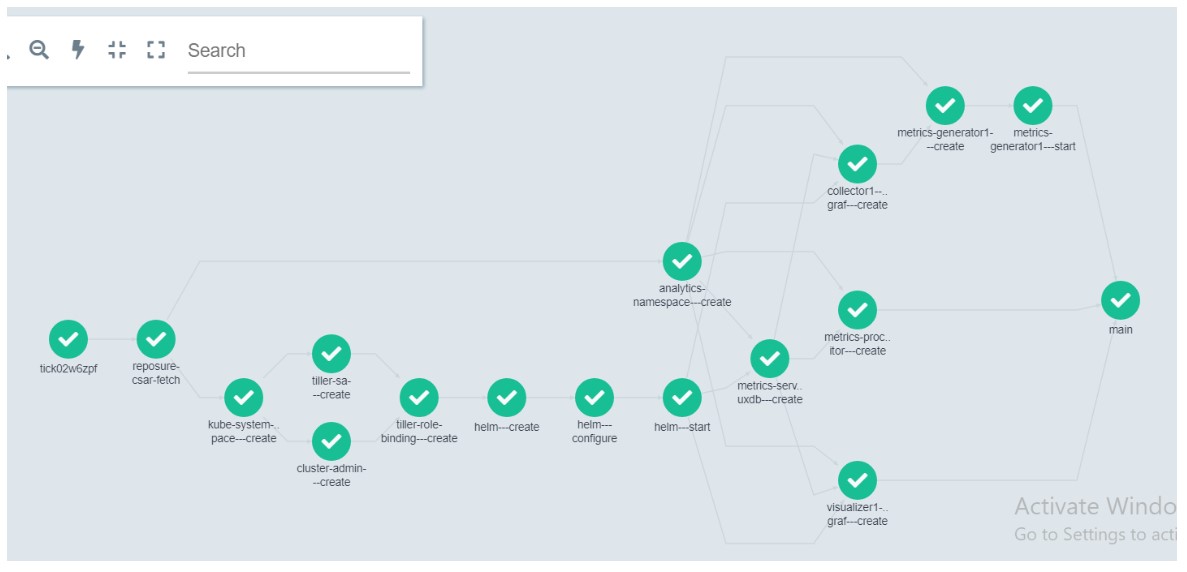
The TICK use case deployment starts with fetching its archive (.CSAR file) from the repository.
It then creates k8s namespaces — tick and kube-system. In kube-system namespace, k8s resources
like Helm, ClusterRole and ClusterRoleBinding are created. All TICK model specific deployment
happens in the tick namespace. Following this, the TICK services namely Telegraph, Kapacitor, Chronograf and Influxdb are deployed in the kubernetes cluster. Finally, the GIN metrics generator service is deployed which sends metrics traffic to the VES collector at a rate determined by number of streams specified.
Here are the details of each step in workflow executed in GWEC (GIN workflow executer container):
– tick{INSTANCE_NAME} :
This is the initial step in Argo workflow for this deployment
– reposure-csar-fetch:
Fetches the TICK TOSCA model archive file CSAR from Reposure.
– kube-system-namespace—create:
Create ‘kube-system’ namespace in Kubernetes cluster if it does not already exist.
– tiller-sa—create:
Creates tiller (the server portion of Helm 2.0) if it does not already exist in the Kubernetes cluster.
– cluster-admin—create:
Creates Cluster Role in kubernetes, which is a set of permissions that can be assigned to resources within a given cluster.
– tiller-role-binding—create:
Creates ClusterRoleBinding in kubernetes. ClusterRoleBinding is used to grant permissions or access to the cluster.
– helm—create:
Gets the required files for installing helm.
– helm—configure:
Configures the helm service.
– helm—start:
Starts helm service.
– analytics-namespace—create:
Create tick namespace which gets used for deploying tick component services.
– metrics-server1—influxdb—create:
Deploy influxdb time-series database service in tick namespace.
– metrics-processor1—kapacitor—create:
Deploys kapacitor pod in tick namespace through helm chart. Kapacitor is used
for creating alerts.
– visualizer1—chronograf—create:
Deploys Chronograf pod in tick namespace through helm chart. Chronograf is GUI for kapacitor which is used to quickly see the data stored in InfluxDB.
– collector1—telegraf—create:
Deploys Telegraf pod in tick namespace through helm chart. Telegraf is a plugin-driven server agent for collecting and sending metrics and events from databases. telegraf sends data to gintelclient.
– metrics-generator1—create:
Creates gintelclient pod in tick namespace through helm chart. gintelclient is a used for sending packets to
kapacitor based on number of streams specified from telegraf.
– metrics-generator1—start:
Deploys gintelclient pod in tick namespace through helm chart
– main:
Main is final step which is used for just specifying end of workflow execution.
Based on the dependencies between the work flow steps, where appropriate, the steps are executed in parallel.